Snow predictions from the Hydrometeorological Prediction Center

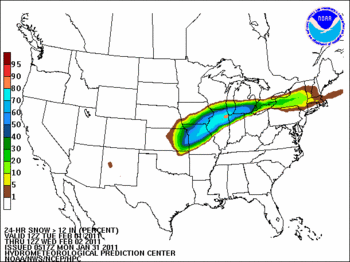
The Ann Arbor area is more than 50 percent likely to get more than a foot of snow on Tuesday, according to the forecast generated by the Hydrometeorological Prediction Center.
Hydrometeorological Prediction Center, NOAA
Snow is in the forecast for the Ann Arbor area. The current weather forecast on AnnArbor.com reads "Heavy accumulations of snow between 10 and 15 inches are possible... with most of this expected to fall Tuesday evening and overnight."
The National Weather Service's Hydrometeorological Prediction Center (HPC) in Camp Springs, Maryland has a winter weather desk, which creates two predictions a day looking into the future to predict snowfall. Each year they come up with something new to help visualize the computer models of winter storms. Here's a review of some of the graphics that are new to this weather season.
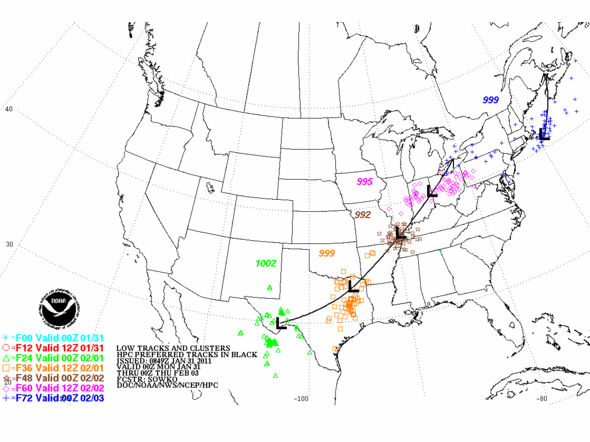
Where is the storm coming from?
Some winter storms are associated with low pressure areas. Forecasters model the paths of these storms in much the same way that they predict the tracks of hurricanes, and if you have ever watched a series of hurricane predictions, you know that from day to day the predictions shift. The map below shows the next 72 hours of this storm, with a solid line in black showing the preferred storm movement forecast and colored marks showing variations between forecast models.

Hydrometeorological Prediction Center
How much snow are we likely to get each day?
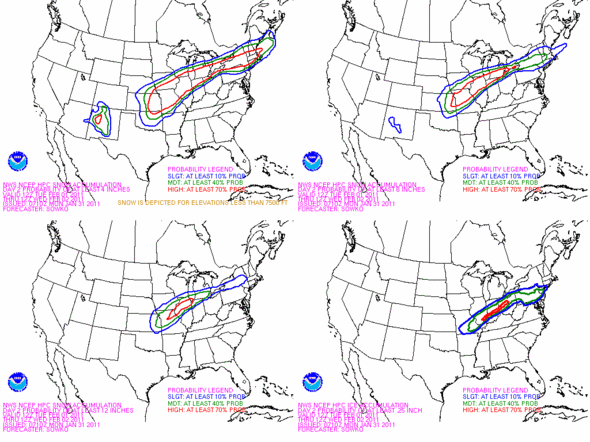
The most compact presentation of upcoming weather is the composite chart provided by the HPC, showing in one image the chance of significant accumulations of snow and ice for the forecast day. The four images show the chances of accumulations of 4, 8, and 12 inches of snow, and the chance of 0.25 inches of ice. This chart shows the Tuesday forecast. Note that travelers heading south need to be wary of ice accumulations forecast across much of Ohio.

Hydrometeorological Prediction Center
Don't simplify it for me
The probabilistic heavy snow and ice discussion provided by the HPC is written by meteorologists for other meteorologists. I've translated a portion of it below, adding punctuation, changing it out of all capital letters and expanding some abbreviations.
As for the main system...a strong low level jet should develop ahead of the surface low and carry western Gulf of Mexico moisture into the lower Mississippi Valley and throw the moisture back across the Arctic airmass that will be in place across the central U.S. to the northeastern U.S. Strong deformation and an upper jet couplet combined with deep layer frontogenesis forcing will provide ample life while energetic southwesterly-westerly flow carries additional moisture through the Ohio valley into the northeast/northern mid Atlantic...with an axis of overrunning (?). This should support a swath of very significant ice accumulations from northeast Oklahoma to southern New England...and very heavy snow from the Central Plains/mid Mississippi Valley across to New England. Models remain in above average agreement regarding the scope of this event, indicating 0.5 to 1.0 inch of freezing rain centered from east central Missouri to west central Ohio, and well over a foot of snow from northern Missouri / northern Illinois to southern Michigan, with perhaps 2 feet across portions of Iowa / Illinois.
Simplify it for me
Edward Vielmetti makes it snow for AnnArbor.com. Throw a snowball at him at edwardvielmetti@annarbor.com.


Comments
Tammy Mayrend
Tue, Feb 1, 2011 : 3:06 p.m.
Thanks Edward, with all of the fresh clean snow I'm thinking a fresh batch of snow ice cream is in order too! <a href="http://www.annarbor.com/entertainment/parenting/snow-day-family-fun---making-snow-cream/">http://www.annarbor.com/entertainment/parenting/snow-day-family-fun---making-snow-cream/</a>
Stephen Landes
Tue, Feb 1, 2011 : 3:25 a.m.
Great stuff, Ed. This is using the graphic element of the internet to really support a story. So much better than trying to just write about it. Thanks.
AlphaAlpha
Tue, Feb 1, 2011 : 2:27 a.m.
Mr. Vielmetti - Thank you for including the 'un-simplified' version. What a refreshing change of pace from the MSM norm. Please do it again, soon.
Ben Connor Barrie
Mon, Jan 31, 2011 : 8:43 p.m.
I really appreciate these data driven posts.
Sarah
Mon, Jan 31, 2011 : 8:32 p.m.
Thanks!
Edward Vielmetti
Mon, Jan 31, 2011 : 8:25 p.m.
All of the big images are from here <a href="http://www.hpc.ncep.noaa.gov/wwd/winter_wx.shtml" rel='nofollow'>http://www.hpc.ncep.noaa.gov/wwd/winter_wx.shtml</a> They do new maps every 12 hours, so the ones I grabbed are not up there now (but you can get a current one).
Sarah
Mon, Jan 31, 2011 : 8:17 p.m.
Is there any way to see bigger versions of the images? Specifically, the last one - I would like to be able to see more of it than "ooh, pretty colors." That said, I appreciate the breakdown!
PittsfieldTwp
Mon, Jan 31, 2011 : 7:21 p.m.
Like Cash says, I really enjoy these map/data heavy posts
Bob Martel
Mon, Jan 31, 2011 : 7:04 p.m.
Good article Ed! Now we just have to figure out how to blame Jennifer Granholm, the unions, City Council, Rick Snyder, and/or the Tea Partiers for the ensuing mayhem!
tdw
Mon, Jan 31, 2011 : 8:09 p.m.
I like the way you covered every one.Very non partianship
Cash
Mon, Jan 31, 2011 : 5:56 p.m.
Edward, you rock!! This is the perfect explanation of what to expect over the next couple of days. Thank you.
Edward Vielmetti
Mon, Jan 31, 2011 : 5:50 p.m.
I'll take snow over ice too. Generally ice storms lead to nasty, nasty power outages, especially if the storm comes with wind.
PittsfieldTwp
Mon, Jan 31, 2011 : 5:44 p.m.
I'll take the 8 inches of snow at 70% chance over the mixed ice to the south of us.