
Flooding links: tracking citizen reports with Crowdmap
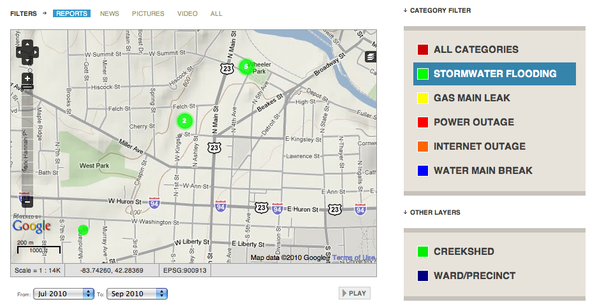
Crowdmap shows locations of flooding along the Allen Creek Drain during Wednesday's storm.
annarbor.crowdmap.com
">Crowdmap is a tool set up for citizen mapping of emergency situations. I used it to help track yesterday's flooding in Ann Arbor and the damage that it created.
What is Crowdmap?
Crowdmap is a map building tool based on Ushahidi, which means "testimony" in Swahili. Ushahidi was initially developed to map reports of violence in Kenya after the post-election fallout at the beginning of 2008. Ushahidi's roots are in the collaboration of Kenyan citizen journalists during a time of crisis. It was used in the Haiti earthquake to map news of that event. This TED Talk is a good introduction from Erik Hersman.
How does it work?
Crowdmap is an aggregation tool for individual citizens, official government and media reports that makes it straightforward to produce maps about events of interest, especially events that are unfolding rapidly in a crisis situation. Direct reports from citizens can come via the web, SMS and email, and editors can pull in news feeds from news media or copy in reports.
Crowdmap is not traditional reporting from professional journalists. It doesn't send people wading into standing water to take pictures, it doesn't file FOIA requests for maintenance records and it doesn't look at budgets line by line to follow the money. What it does allow is a way to get a bigger picture than any one person can immediately grasp and help zoom in on relevant and interesting materials that could be of use.
What is set up around here
I've set up annarbor.crowdmap.com as a testbed to help understand the system and also to help collect and analyze some of relevant information about the storms Wednesday, which overflowed storm sewers in the Allen Creek watershed.
This is not an official project, just a testbed right now. It's set up with color coded markings to track infrastructure issues that we regularly write about - storm sewer problems (in green), water main breaks (in blue), Internet outages (in orange), power outages (in red), and gas main breaks (in yellow). These correspond to the Michigan Utility Color Code, which is managed by MISS Dig. Call 1-800-482-7171 before digging.
What are similar projects
Google maps can crowd-source and map data entry, using its own built-in collaboration tools. In that system, each point is just that, a point; there's no tracking trail that lets you evaluate the accuracy of any individual report or refine details.
My previous mapping coverage included my siren testing story from earlier this week, and a power outage map from December 2009.
How is this new?
I've used Google Maps before, and Crowdmap offers some new capabilities. It allows you to import more map layers like watershed and political boundaries to determine context for event reports.
My initial setup took less than an hour; there were a few rough edges, mostly because I had to learn how the information was stored and used.
Mapping in this system has an interesting and unusual behavior where related points are grouped together. This makes sense for social maps where people nearby are like each other, but is weird for physical maps where it's unsettling to say "the corner of Felch and Ashley street" and get back a dot on the map that's not precisely there.
There is some sense of time on the maps, but I haven't completely sorted it out. I'd love to have accurate time and location information for previous flooding events going back as far as there are records, but it would be odd for these to show up on the default map of current information.
Other records of flooding in the area
Arborwiki's page has been collecting bits of news about area flooding, without a comprehensive map.
AnnArbor.com "flooding" tag has stories we have written.
Worldwide flooding news
My single best source of flooding information worldwide comes from Dave's Landslide Blog:
"This blog provides a commentary on landslide events occurring worldwide, including the landslides themselves, latest research, and conferences and meetings. The blog is written on a personal basis by Dave Petley, who is the Wilson Professor of Hazard and Risk in the Department of Geography at Durham University in the United Kingdom."
Dave has a calm, thorough, professional and timely set of scientific reporting about major flooding events worldwide, especially those which result in landslides, mudslides, or other mass movements of earth.
His latest update on disaster events speaks of the flooding in Pakistan:
"The sheer magnitude of the disaster in Pakistan is difficult to comprehend. Unfortunately the true horror of this event is probably remaining hidden; the real impact will come when the water levels in the south subside to leave polluted water wells, destroyed homes and wrecked crops. The legacy of this disaster will be long-lasting, and will have a profound impact on Pakistan and elsewhere."
Getting detailed information about world events relies often on local reporting; Dave quotes frequently from the Pamir Times, a community media initiative operating in Gilgit - Baltistan since October 2007.
Edward Vielmetti sometimes writes about municipal infrastructure for AnnArbor.com. Contact him at edwardvielmetti@annarbor.com.Â
Comments
Andrea
Fri, Aug 13, 2010 : 8:17 a.m.
Now if we could just extend it to track comcast tv viewing pixelation issues!
Matt Hampel
Thu, Aug 12, 2010 : 10:30 p.m.
Old Salt, if you browse to http://annarbor.crowdmap.com/, you can zoom and pan around the map just like a google map. Maybe there's some way to link the image of the map to that page. Ed: I find that the Google Physical maps makes a neater default; it still contains the important bounds but has much more muted colors.
Old Salt
Thu, Aug 12, 2010 : 10:55 a.m.
It would be nice if the map were a little larger so we could read where the streets and areas are that were flooded..